UX patterns · Enterprise software
UX best practices for data tables
Tables are where enterprise software does its real work. Small decisions make them faster to scan, safer to act on and easier to trust.
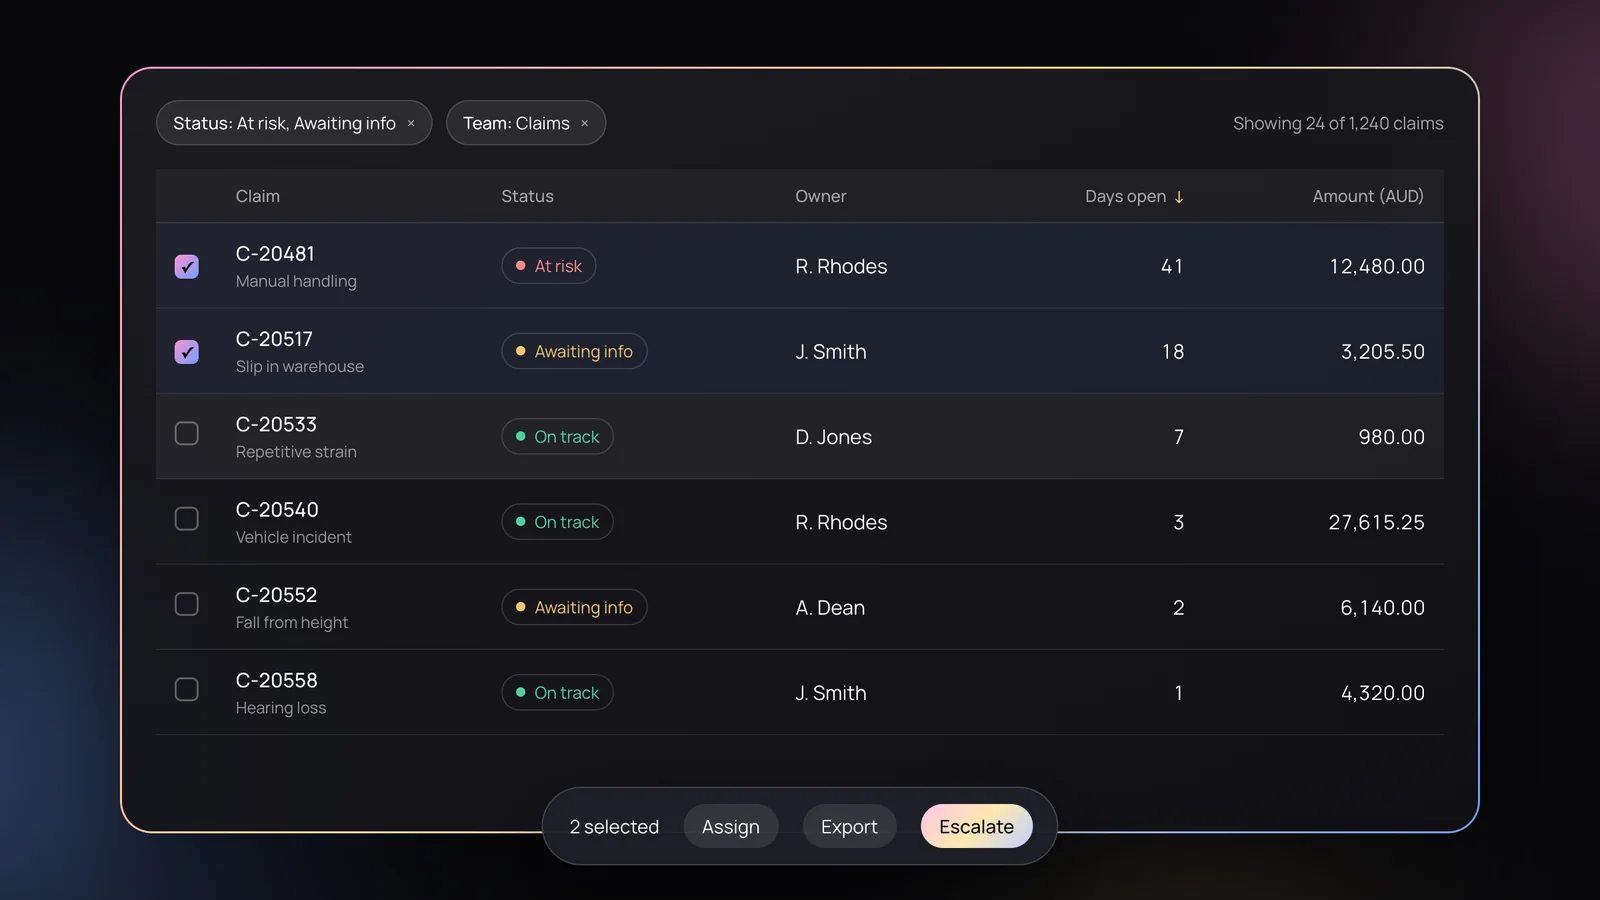
Dashboards get the attention, but tables get the work done. In claims systems, risk registers, banking platforms and admin tools, people spend hours a day reading, comparing and acting on rows of data. A well-designed table quietly saves all of that time. A poor one costs it, every day.
These are the practices we come back to on almost every product design project that involves serious data, with interactive prototypes you can try along the way.
1. Start with the job, not the columns
Before deciding what to show, ask what people come to the table to do. Are they scanning for problems, comparing values, finding one specific record, or working through a queue? Each job suggests a different default sort, different columns up front and different actions. A table built from “every field in the database” serves none of them well.
2. Give the table the screen
For people who work in tables all day, the table isn’t a component on the page; it’s the workspace. Yet a common pattern squeezes it into its own scrolling box below filters, banners and summary tiles, so huge datasets are explored through a small window while most of the screen sits unused.
A better pattern lets the page become the table’s viewport. The table grows with its rows and the page scrolls; as you reach it, it captures its header row and fills the screen, while the content above stays where it belongs. It’s a pattern we designed for bankers working with very large datasets, and it works anywhere tables are the main event.
How it’s built CSS and a little JavaScript
/* The table has no height of its own: the page scrolls,
   so the page is the table's viewport. */
.table-heads { position: sticky; top: 0; }
.table-body  { overflow-x: auto; overflow-y: hidden; }
.first-cell  { position: sticky; left: 0; }
.scroll-bar  { position: sticky; bottom: 0; }

/* The header can't sit inside the horizontal scroller
   (overflow-x makes it a scroll container, so the header
   would stick to the wrong thing). It sits above it, and
   follows the scroller in JavaScript: */
body.addEventListener('scroll', () => {
  heads.style.transform = `translateX(${-body.scrollLeft}px)`;
  // ...and the custom scroll bar's thumb mirrors it
});
3. Keep context in view
A full-screen table still has to show people where they are:
- Sticky column headers so a column’s meaning is never lost while scrolling down.
- A fixed first column (usually the name or ID) so each row stays identifiable while scrolling sideways.
- A visible horizontal scroll control fixed to the bottom of the screen, so moving sideways never means hunting for a scroll bar at the end of a long table. It also helps anyone who relies on visible scrolling controls.
4. Align for scanning
- Text left, numbers right. Right-aligned numbers line up by place value, so differences jump out.
- Use tabular figures (
font-variant-numeric: tabular-nums) so digits have equal widths and columns stay tidy. - Align headers with their content. A right-aligned number column needs a right-aligned header.
- Keep units in the header, not repeated in every cell: “Amount (AUD)” rather than “$” on each row.
Use the “Numbers” switch in the table below to compare.
5. Choose a sensible density, and let people change it
Dense tables fit more on screen; comfortable ones are easier to read and click. For most business tools, rows around 44–56px tall work well, with a compact option for power users who live in the table all day. Keep interactive targets at least 24px, and larger on touch devices.
6. Make sorting, filtering and counts obvious
- Show which column is sorted and in which direction, and let people sort by clicking the header.
- Keep active filters visible above the table, easy to turn off, with a single “Clear all”.
- Always show the result count, so people know whether a filter worked: “Showing 24 of 1,240 claims”.
- Remember filters and sort order when people come back to the table.
| Claim | Status | Owner |
|---|
7. Make rows easy to follow
Use subtle horizontal dividers or very light zebra striping, plus a clear hover state, so the eye can track across a wide row. Avoid heavy vertical borders; spacing does that job better.
8. Format data for meaning
Statuses should combine colour with a text label, so they work for people with colour vision deficiencies. Put secondary detail in a lighter line under the main value rather than in another column. Format dates consistently, and consider relative dates (“2 days ago”) where recency matters more than the exact day.
9. Design actions for one row and many
- Put the most common row action in view, not hidden inside a “more” menu.
- Use checkboxes for selection, and show a bulk-action bar only once rows are selected, with the selected count.
- Make “select all” clear about whether it means this page or every matching result.
- Confirm destructive actions, or better, offer undo.
10. Be selective with columns
Lead with the columns that answer the main job, and push secondary detail into a row expansion or detail panel. For varied audiences, let people show, hide and reorder columns. When text must be truncated, truncate with an ellipsis and show the full value on hover or focus, never silently.
11. Plan the states, not just the happy path
Every table needs designed states for loading, empty results, first use and errors. These are the moments people remember.
Try a different status or date range.
New claims appear here as soon as they’re lodged.
The connection timed out. Your filters are saved.
12. Pagination, load more or infinite scroll
For work tables, pagination or “load more” usually beats infinite scroll: people can keep their place, share a page and reach the footer. Whatever you choose, show the total and let people change how many rows they see.
13. Don’t just squash it on mobile
A ten-column table won’t fit a phone, and shrinking text isn’t the answer. Either allow horizontal scrolling with a sticky first column, or switch to cards that show the most important fields per row. Decide based on whether mobile users compare rows or look up single records.
Open claims
| Claim | Status | Owner | Days | Amount (AUD) |
|---|---|---|---|---|
| C-20481 | At risk | R. Rhodes | 41 | 12,480.00 |
| C-20517 | Awaiting info | J. Smith | 18 | 3,205.50 |
| C-20533 | On track | D. Jones | 7 | 980.00 |
| C-20540 | On track | R. Rhodes | 3 | 27,615.25 |
Manual handling
R. Rhodes · 41 days$12,480.00
Slip in warehouse
J. Smith · 18 days$3,205.50
Repetitive strain
D. Jones · 7 days$980.00
Vehicle incident
R. Rhodes · 3 days$27,615.25
14. Build it accessibly from the start
- Use a real
<table>with<th scope="col">headers and a caption, not a grid of divs. - Expose sort state with
aria-sort, and make headers, filters and row actions reachable by keyboard. - Keep contrast at WCAG AA for text, including muted secondary text.
- Announce changes in result counts after filtering for screen reader users.
A quick checklist
- The default sort and first columns match the main job.
- The table gets the screen, with headers, the first column and sideways scrolling always in reach.
- Numbers are right-aligned with tabular figures; units live in headers.
- Density suits the work, with a compact option.
- Sorting, filters and result counts are always visible.
- Statuses use text, not colour alone.
- Bulk actions are clear about what’s selected.
- Loading, empty, error and first-use states are designed.
- The mobile approach is chosen deliberately.
- It’s a semantic, keyboard-friendly table.
Tables reward the same thinking as the rest of a product: understand the job, remove friction and stay consistent. If your product leans on complex data, a design system with well-specified table patterns is one of the best investments you can make.